
Case Study 03
Every card has to earn the morning.
Designing the first screen a landlord sees each day — deciding what belongs above the fold, what gets cut, and how an AI summary can help without pretending to know more than it does.
Role
Product owner & designer
Scope
Home dashboard, hierarchy metrics, AI summary, scale
Timeline
Jun 2026
Status
Concept, pre-launch
The problem
Every tab in the portal wants a spot on the dashboard. If they all get one, the landlord scrolls past stats and charts to find the request that expires in an hour. A dashboard that shows everything prioritises nothing.
My approach
Started from four questions a landlord brings to the page, then gave every module an entry test. Most of the work was saying no — to a metric, a section, a counter — and moving it somewhere it would be more useful.
The results
A strictly ordered page: AI summary, two stats, three action sections above the fold, then context below. Metrics that change with the calendar, an honest quiet-day state, and a venue table that holds up at 15+ venues.
01 Context
The page that sits on top of every other page
By the time I designed the Dashboard, Finance, Bookings and Calendar each had their own logic. The Dashboard isn't a fifth feature; it's a summary of the other four, so it inherits their rules — urgency from Bookings, held-versus-released money from Finance, subspace availability from Calendar.
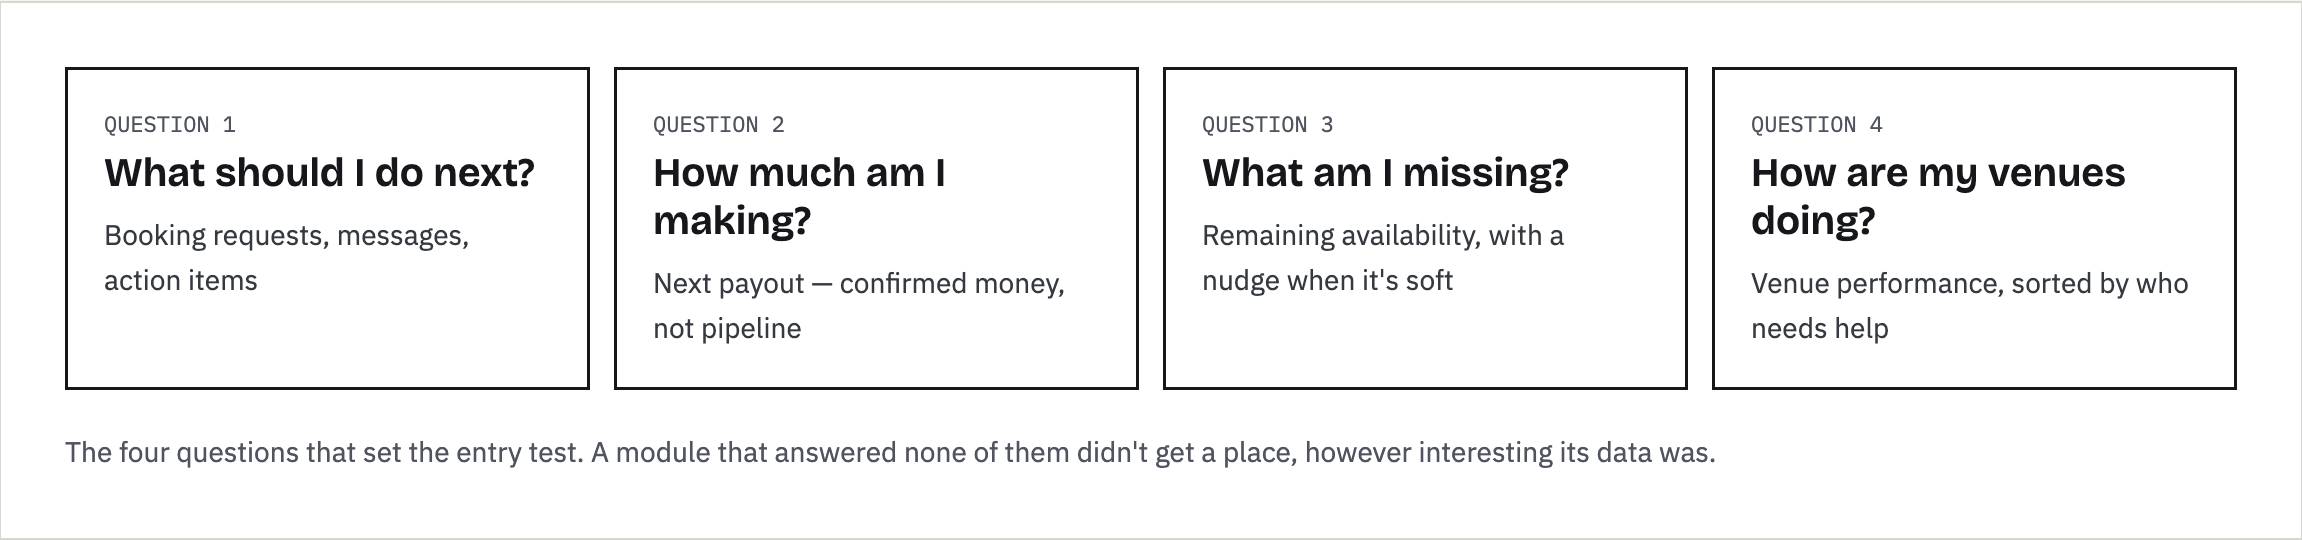
Before any layout, I wrote down the four questions a landlord brings to this page. Every module had to answer one of them.
02 Research
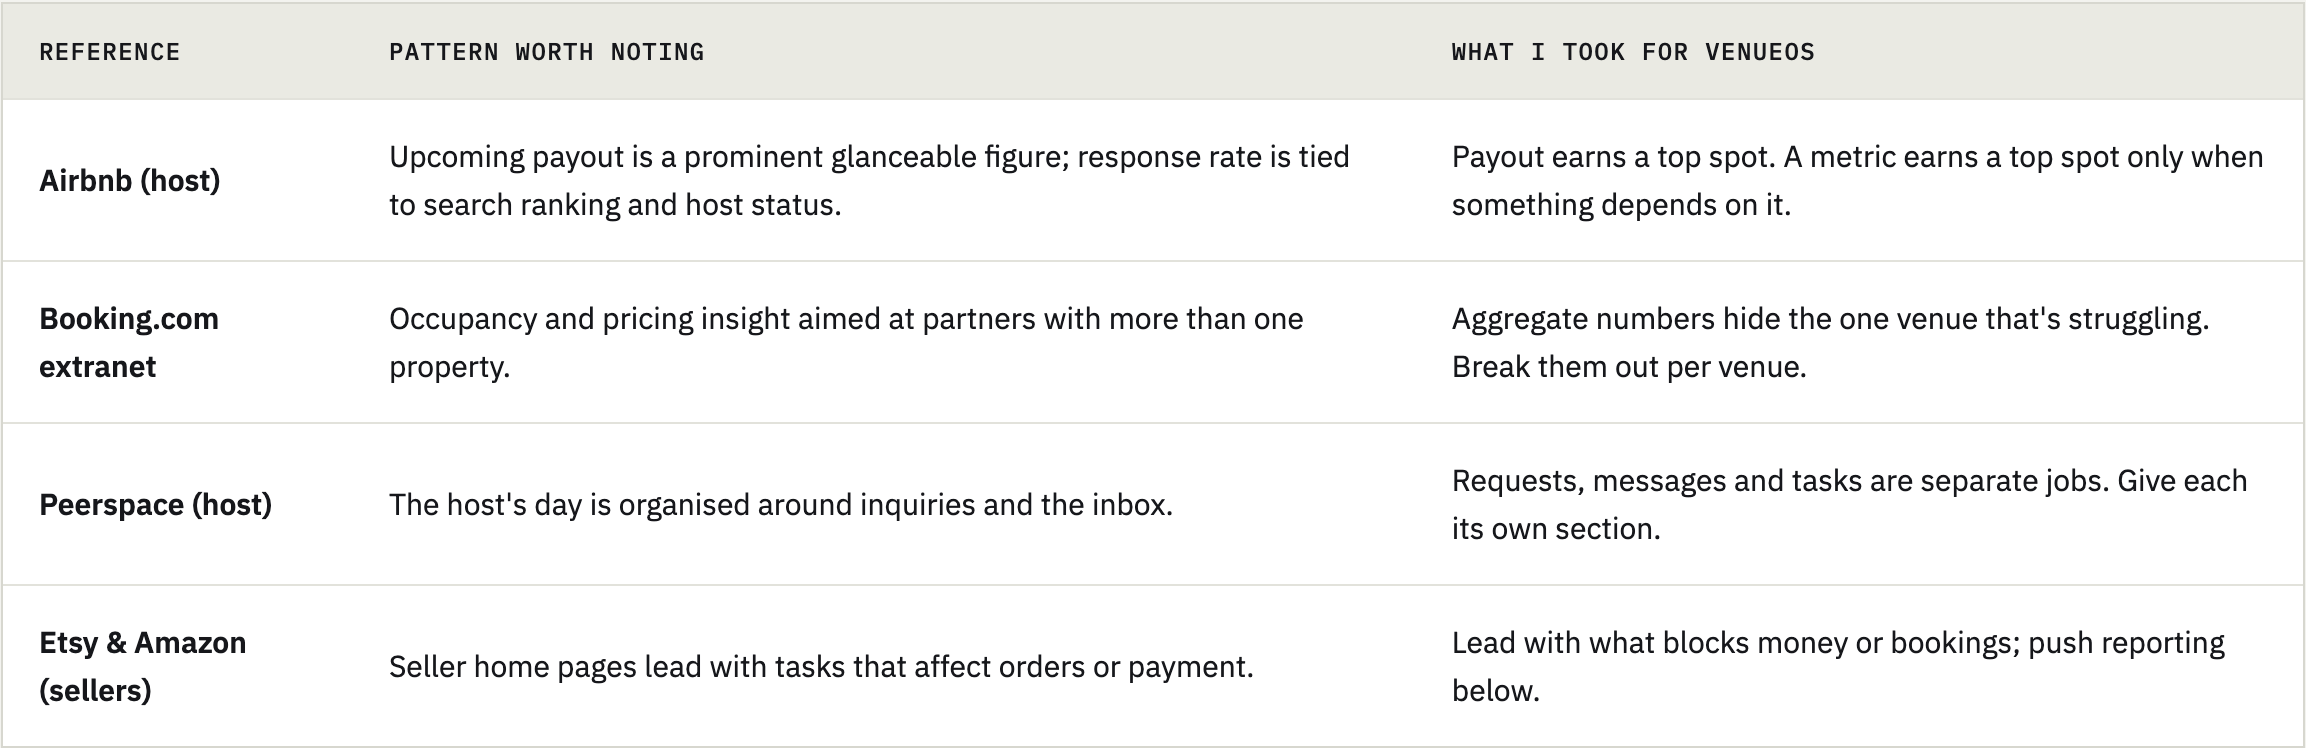
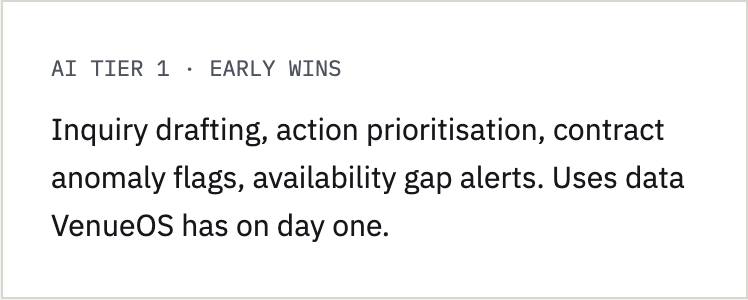
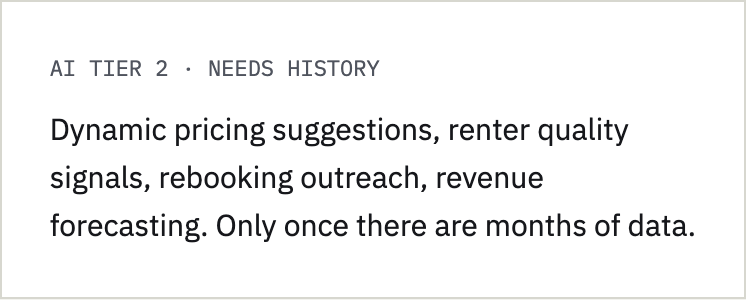
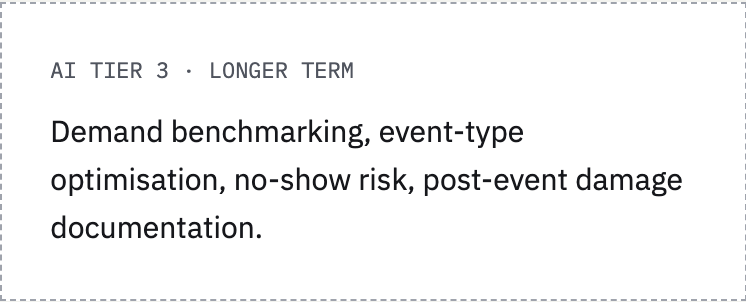
I compared host and seller dashboards, then brainstormed real landlord problems before deciding where AI could help. The goal was to avoid adding AI for its own sake: each idea had to map to a problem, and to data the platform would actually have.
Pain points first, then AI
Honest scope: this phase was competitive analysis and persona-driven design. No primary landlord interviews or usability tests yet — those are in the validation plan below.
Synthesis: The question behind the page
“What needs me today, and is anything quietly going wrong?”
The first half is triage. The second half is the job most dashboards skip: noticing the slow problem — a venue half-empty for the rest of the month — before it shows up in the payout.
03 Who it’s for
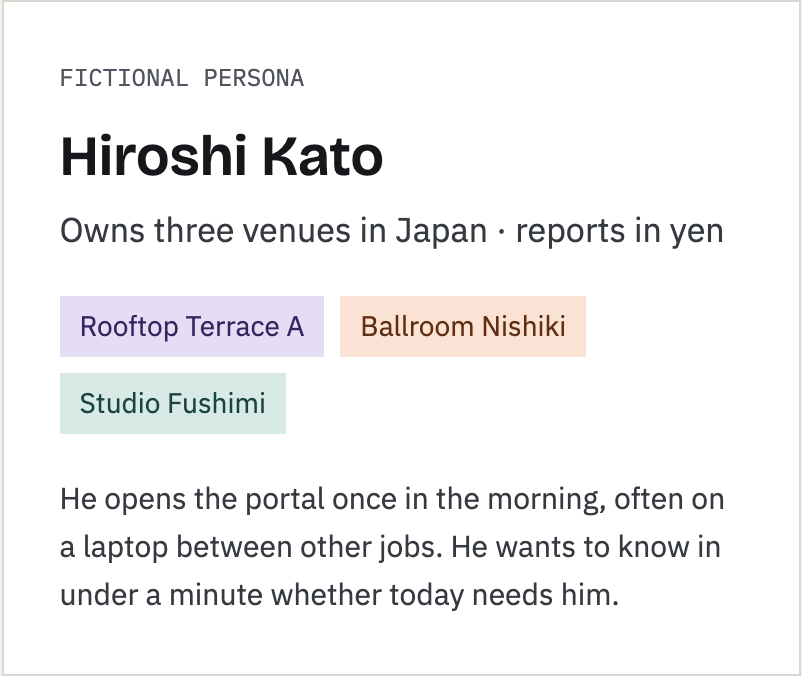
Three venues today, fifteen tomorrow
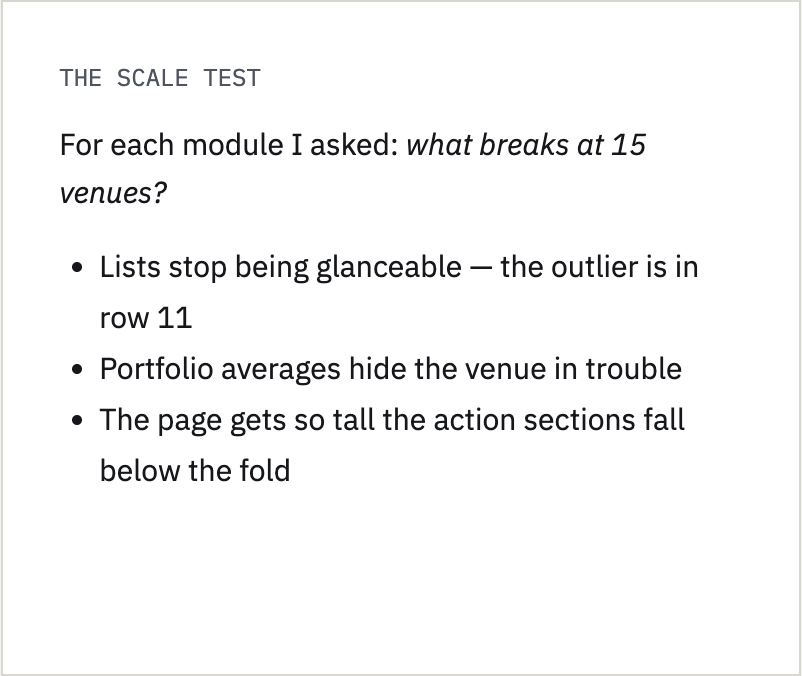
I designed for Hiroshi as he is, then stress-tested every module at five times his size.
04 Iterations
Fourteen versions, six decisions that mattered
The dashboard went through many mockup rounds. These are the points where the thinking changed — including one where my own rule turned out to be inconsistent.
01
Self-correction
"Actionable" was the wrong test
The stat row started with three cards: Next Payout, Response Rate and Remaining Availability. I proposed cutting Response Rate because it wasn't actionable. Then the obvious problem: Next Payout isn't actionable either, and it clearly belongs. The rule was being applied to one card and not the other.

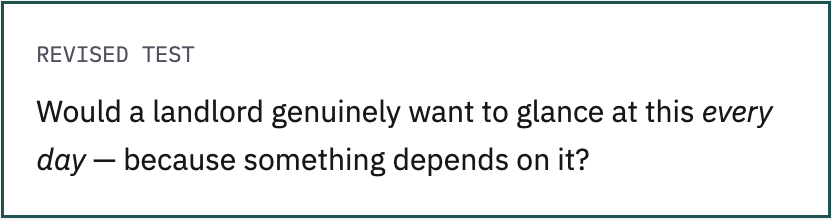
Next Payout passes: it's money, checked constantly. Response Rate fails for now: VenueOS doesn't yet tie it to ranking or a badge, so it's a number with no consequence. It fits better as an occasional nudge in the AI summary — "2 requests from last week are still unanswered." If responsiveness ever affects visibility, it earns the slot back.
Why it matters: a design rule is only useful if it's applied consistently. Catching the inconsistency led to a better rule, not just a different answer.
02
Metrics over time
The right number depends on the date
Occupancy month-to-date is misleading early in the month: on the 3rd, one empty Sunday reads as "33% occupied". So the stat changes with the calendar:
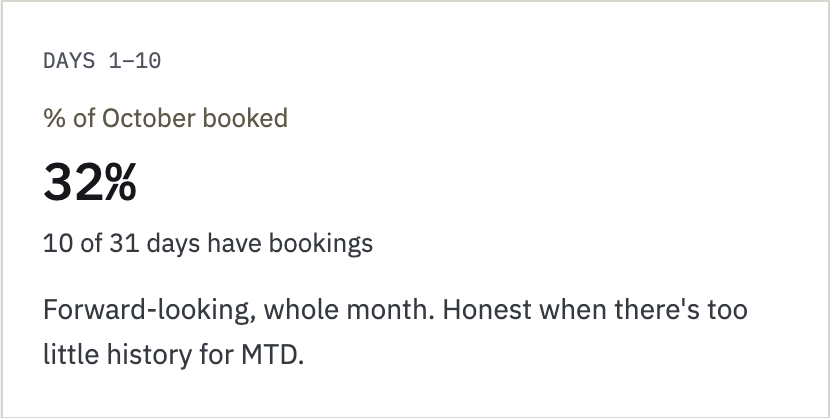
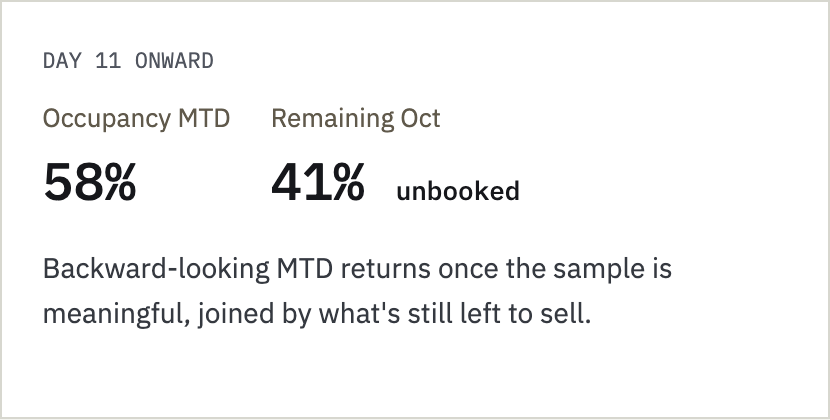
"Remaining availability" is framed as % unbooked, not % occupied. It's the same number, inverted, but "60% unbooked" reads as an opportunity while "40% occupied" reads as a status report.
Why it matters: a metric isn't just a formula; it's a claim about the business. Showing a volatile number on day 3 would make the dashboard less trustworthy than showing no number.
03
Thresholds
A nudge that only speaks when it should
When remaining availability is soft, the card turns amber and suggests a short-term rate. The threshold is a flat 50% unbooked: easy to explain, and conservative enough not to fire on normal variation.
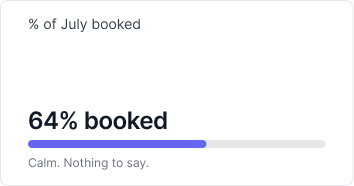
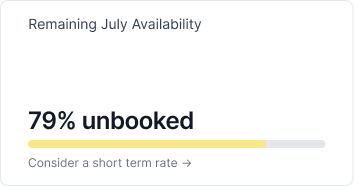
I chose not to let landlords set their own threshold. Most never open settings, and without history they'd have no basis for picking 60% over 70%. The known risk: a venue that's normally quieter could trigger the nudge every month until landlords ignore it. The planned fix is an automatic per-venue baseline once VenueOS has enough data — not a setting.
Why it matters: a nudge that fires constantly is a smoke alarm people take the battery out of. Ship the simple rule, name its failure mode, and plan the smarter version.
04
Hierarchy
Three sections, not four — and a fold line that means something
The section grid started with four equal sections: Booking Requests, Messages, Action Items and Notifications. Notifications was the odd one out — informational rather than actionable, and needed on every page, not just this one. It moved to a bell in the sidebar header, visible portal-wide, and Action Items gained full width.
Then the page-height check. On a typical laptop, the This Week strip sat between the stats and the action sections, pushing requests below the fold. It's useful but not urgent, so it moved down. The final order is strict:
AI daily summary
Stat row: Next payout, Remaining availability
Booking requests
—————————-
Action items
Messages
This week
Booking stats
Why it matters: "above the fold" is a budget, and anything that spends it has to be more urgent than what it pushes down.
05
AI honesty
An AI summary that admits when it's a quiet day
The summary at the top connects dots across sections — an overdue invoice, three overlapping requests for one date, a venue half-empty for the rest of the month — in one paragraph. Three constraints kept it honest:
A front door, not a new feature. Every link goes to a flow that already exists elsewhere on the page.
Dismissible. If it has nothing useful to say, the landlord shouldn't be forced to read it.
No invented insight on quiet days. The risky case is a day with nothing urgent, when an AI will stretch to sound clever.
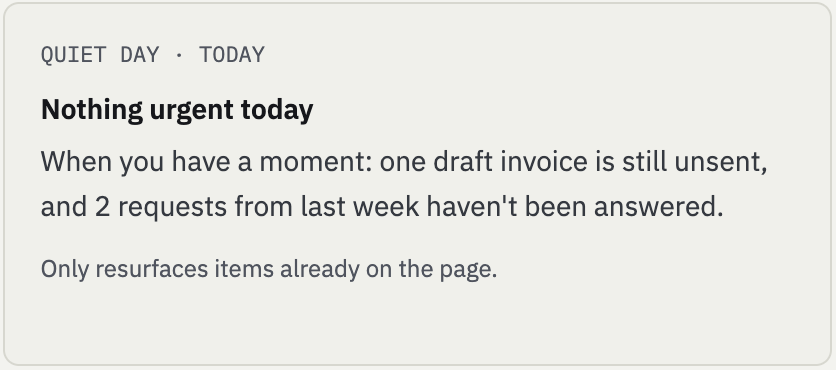
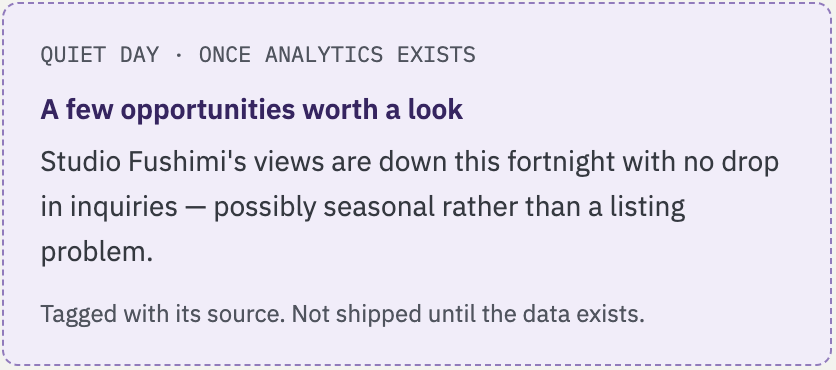
Why it matters: AI features lose trust the first time a user notices the "insight" was hollow. Designing the empty state first is how you protect the full one.
06
Scale & scope
Problems float up, traffic counters go elsewhere
At 15 venues, the performance table stopped being glanceable. The fixes, in order of impact:
Attention-first sort. Most unbooked at the top, so the 2–3 venues in trouble appear without scrolling.
"4 need attention" badge. Tells you there's a problem before you read a row; one click filters to them.
Fixed-height scroll, like every other section. No pagination.
Name filter and alternate sorts for landlords who know which venue they want.
The same discipline applied to a request to add listing traffic — views, shortlists, shares. The data is genuinely useful for diagnosing why a venue isn't converting, but a landlord can't act on "viewed 340 times" this morning. It became the core of the future Analytics page, where a full funnel can do it justice.
Why it matters: saying no to a good idea on one page is often how it gets a better home on another.
05 The design
Hiroshi's dashboard on Tuesday 20 October. Numbered callouts map to the notes below.
Answer first, detail on demand
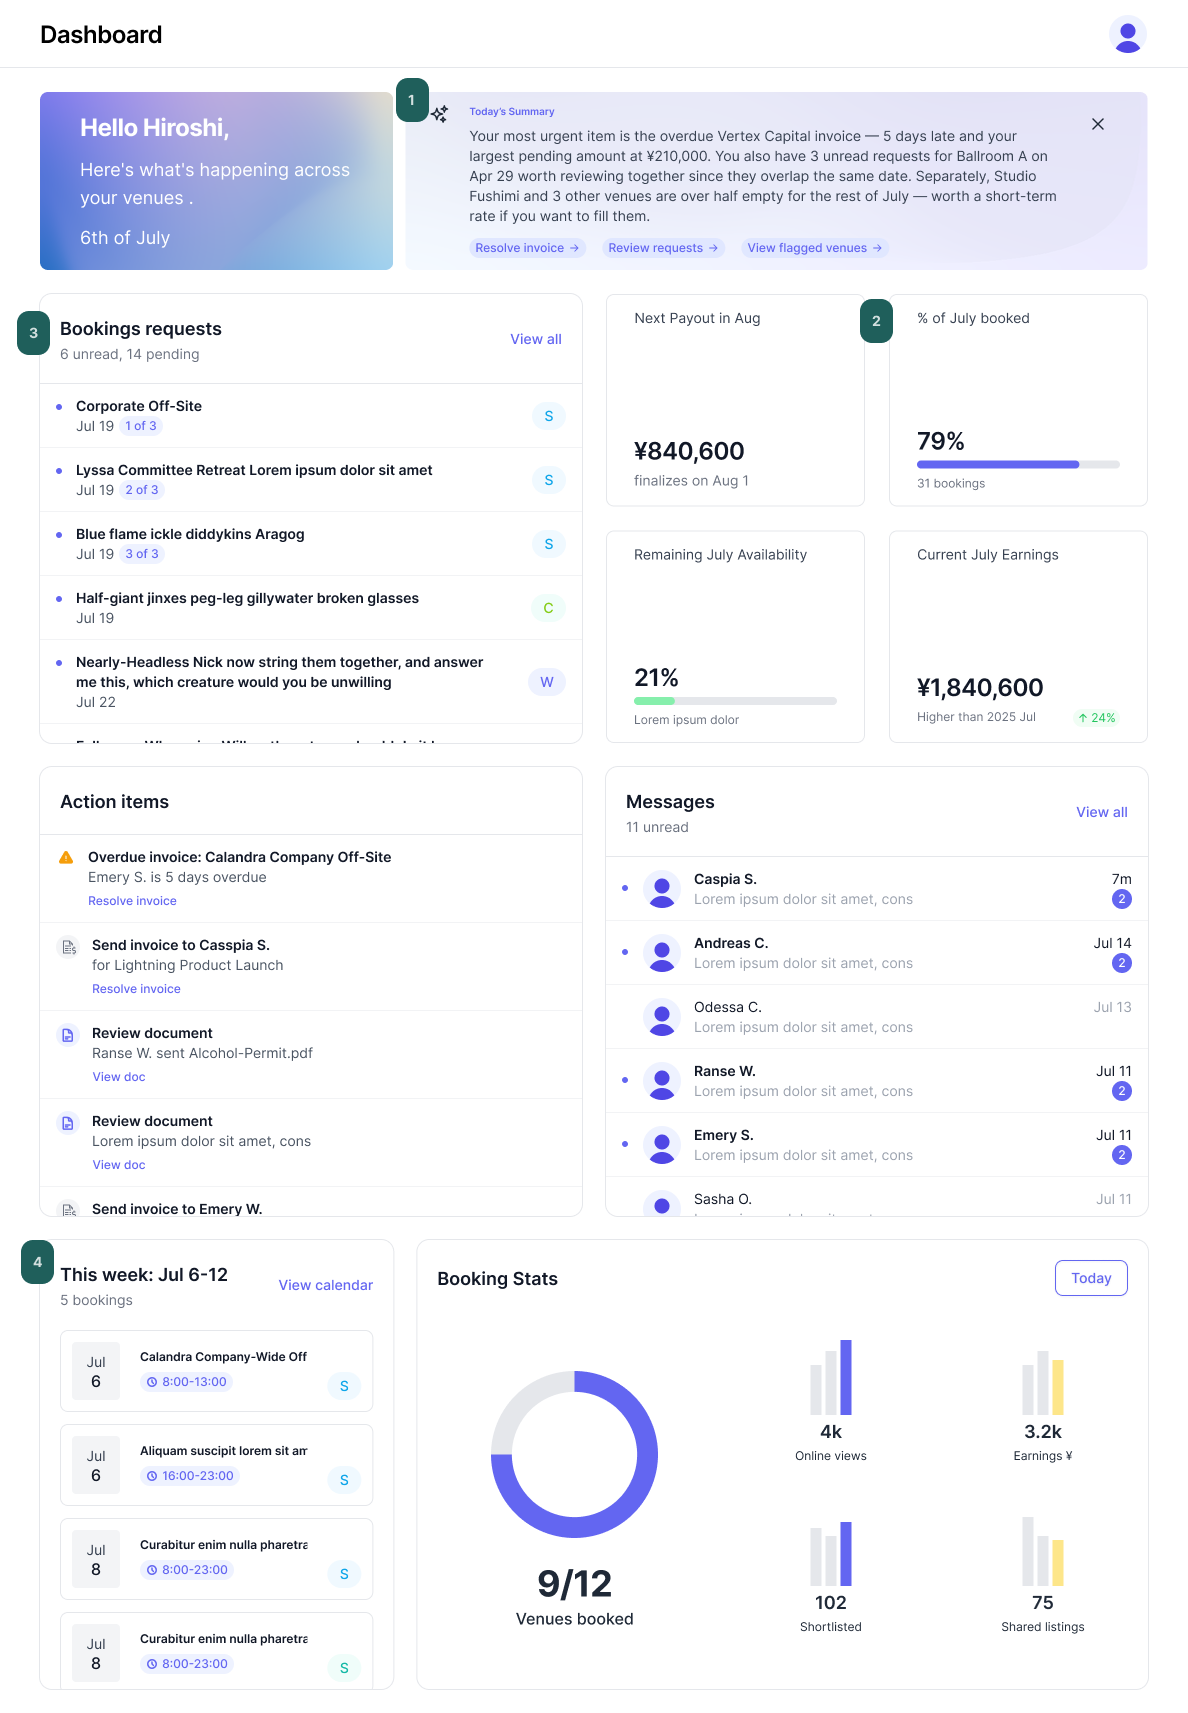
01 A smarter front door
One paragraph connecting three sections. Every link points to an existing flow. Dismissible.
02 Two stats, four stats
Next payout always shows next to % of bookings. Remaining availability and month’s earning shows conditionally.
03 Three jobs above the fold
Booking requests carry more severity, earning its place above the fold.
04 Context below
This week and booking stats moved under the fold: useful, but never more urgent than a request.
06 Strategy layer
Rules that outlived the screen
The Dashboard is where the portal's rules meet. These are the ones it added.
Questions before modules
Write down what the user is asking, then admit only what answers it.
Apply the rule to everything
If a test removes one card, run it on every card. If the answer feels wrong, fix the test.
Honest metrics
Show the number that's true for today's sample size, not the one that's always there.
Design the empty state first
Especially for AI. A quiet day tells you whether a feature is real.
Design for 5× the persona
Three venues hides the problems fifteen will reveal. Find them before launch.
No is a routing decision
Cutting something from one page means deciding where it belongs instead.
07 Next
Validation plan
What I'd run before build, to replace persona assumptions with evidence.
Diary study with multi-venue operators: what do they check first each morning, and in what tool?
Five-second and first-click tests on the prototype:
"What needs your attention today?"
"When is your next payout, and how much?"
"Which venue would you worry about this month?"
"Is anything overdue?"
AI summary trust test: show busy-day and quiet-day versions; do landlords believe it, and would they keep it switched on?
Resolve open items: whether Response Rate earns back a stat slot; whether the 50% threshold over-fires for naturally quieter venues; and the Notification Center and Analytics pages this page links to.
08 Reflection
The hardest design work on this page was deciding what wasn't on it.
A dashboard is where every team's priorities compete for space. Giving each module an entry test — and applying it to every module, including the ones I liked — is how the page stayed useful. That's the role I want to play in a startup: holding the line on focus, and making sure "no" always comes with "here's where it goes instead".